Designer View(Last update of this topic: 10-11-2022) |
  
|
(Last update of this topic: 10-11-2022)
Designer View(Last update of this topic: 10-11-2022) |
|
Once you have opened the selection view of the reports - as described in chapter Reporting - you can have any number of reports displayed in the designer view.
For this purpose, select a report - or even several by means of the control-/shift buttons - and click Open report designer / Open empty report (see figure Opening reports in the designer view).
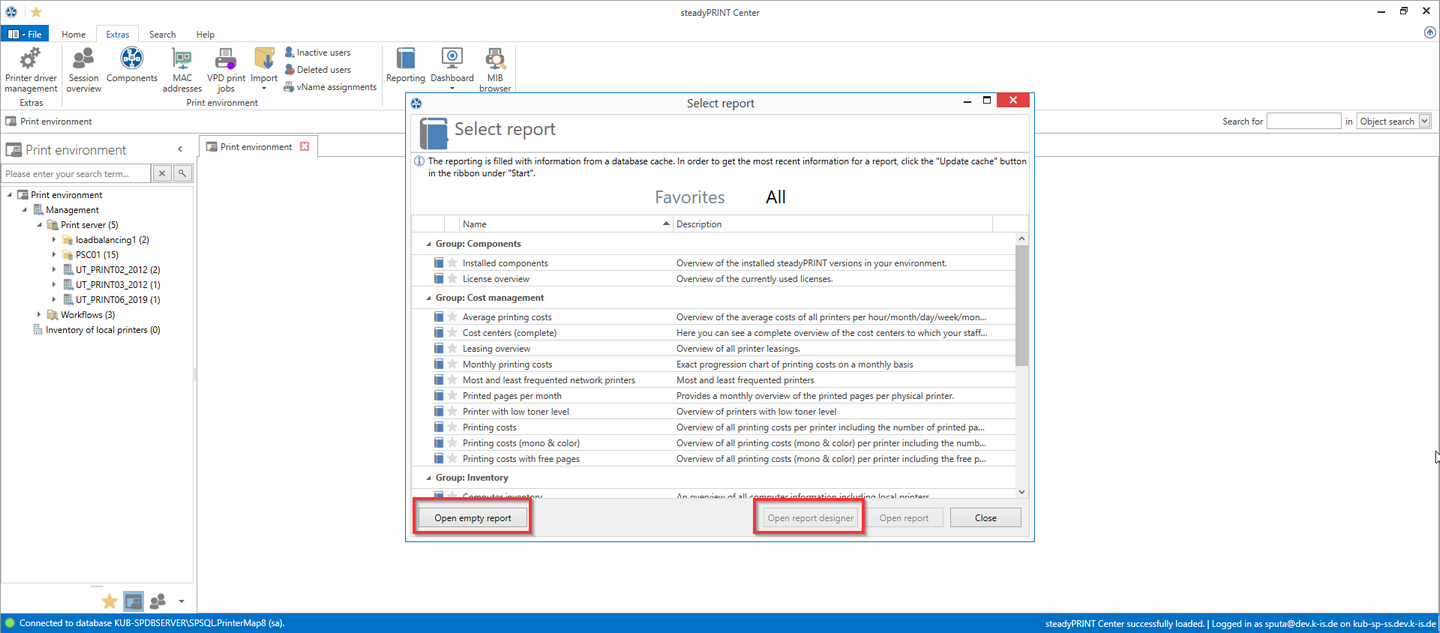
Figure 165: Opening reports in the designer view
The new view offers various adaptation options - depending on the button you have chosen.
Opening existing reports in the designer view
Here, you have the option to adjust an already existing report and to save it under a new name.
In our example we use the report Printing costs.
First, you will see the ribbon at the top of the window - as you already know from the steadyPRINT Center. Here, settings for the page orientation or a watermark can be added.
At the left edge of the window, you will see the available control elements (e.g. diagrams or bar codes) that can be added to the report.
At the bottom edge of the window, you will see how the data is arranged and sorted in your report. Groups and sortings can be added, removed and sorted.
At the right edge of the window, you will see the elements that are already part of your report in the upper area, the fields that have been made available through the data connection and below the properties of the element, selected on stage.
Having adjusted the report according to your ideas and wishes, you can view it including live data via the button Print Preview in the upper right corner of the window.
In order to save the report in the system, use the button Save in database in the ribbon and enter a name, a description and a category.
In addition, you can save a definition file in the file system via Save and Save as which can later be retrieved via the button Open in the ribbon.
Creating empty reports
Here, a completely new report with a customized data connection can be created.
Having clicked the button Open empty report, a completely empty window appears. Now click + at the top left edge, above the ribbon. A wizard window opens leading you through the basic configuration of your new report.
Having arranged the report according to your ideas and wishes, you can save the report as described in chapter Opening existing reports in the designer view.